
7 Best Bulk Transport Solutions for Global Buyers
Global buyers need more than a low freight quote when selecting Bulk Transport solutions. They need dependable capacity, clear documentation, safe handling, and realistic delivery windows. A shipment of grain, minerals, chemicals, or construction materials can involve rail wagons, trucks, barges, terminals, and ocean vessels. Each transfer creates another point of risk.
Donald J. Bowersox, a respected supply-chain logistics scholar, wrote, “Logistics is the work required to move and position inventory throughout a supply chain.” His observation explains why bulk shipping should be assessed as one connected operation, not as isolated transport legs. The seven solutions reviewed here compare multimodal planning, dedicated trucking, rail freight, inland waterways, ocean bulk carriers, intermodal services, and specialized terminal networks.
Reliability matters most.
Strong providers show measurable performance. Look for cargo tracking, calibrated loading systems, contingency planning, trained operators, and transparent surcharge policies. Storage conditions also deserve attention. Moisture, temperature, dust, contamination, and loading delays can damage both goods and margins.
Still, no transport method is perfect. A cheaper route may create longer port exposure. A faster option may offer less capacity during peak seasons. Weather can disrupt even carefully planned schedules. Buyers should question impressive promises and test them against lane-specific evidence, insurance terms, handling records, and customer references.
This guide offers a practical starting point. It does not replace professional risk assessment. Yet it can help global purchasers choose Bulk Transport partners with greater confidence, fewer surprises, and clearer operational accountability.
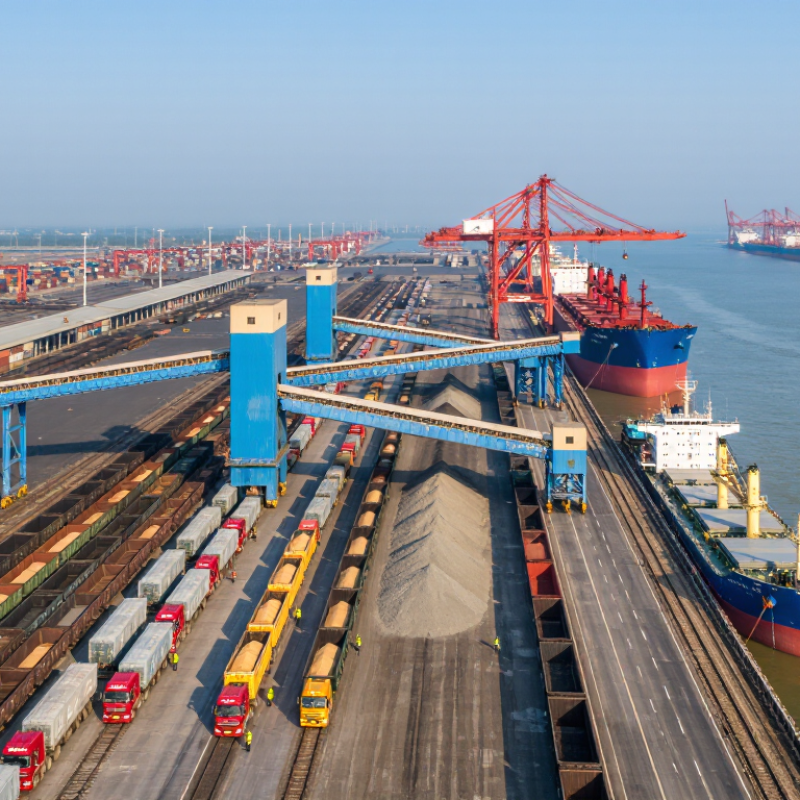
Global Baseline: Maritime Shipping Moves About 80% of Trade by Volume (UNCTAD)
Global bulk buying still starts at the waterline. UNCTAD’s Review of Maritime Transport 2024 states that maritime shipping carries over 80% of global merchandise trade by volume. This figure gives buyers a practical baseline, not a decorative statistic. Bulk carriers suit stable flows of grain, ore, minerals, and other commodities. Tankers serve compatible liquid cargo under applicable safety rules. Containerized bulk works better for smaller lots needing cleaner handling. Port-to-port contracts should define loading windows, draft limits, moisture rules, and inspection points. Small omissions become expensive at the quay.
Four other solutions complete the network. Barges can reduce inland congestion near navigable ports. Rail links provide steadier inland movement over long distances. Trucks remain essential for short first- and last-mile legs. Transloading allows cargo to shift between vessel, rail, and truck. Digital tracking helps buyers compare arrival estimates with inventory buffers. UNCTAD also reports that rerouting, port congestion, and disruptions can raise shipping costs. The International Maritime Organization’s Fourth GHG Study 2020 estimated shipping produced about 2.89% of global carbon dioxide emissions in 2018. That figure deserves attention when comparing routes. Yet no model is perfect. A cheaper ocean leg may create storage, demurrage, or delay costs. A tested route with backup capacity is often safer than the lowest freight quote.
| Transport Solution | Typical Cargo | Typical Capacity | Typical Transit Speed | Cost Position | Best Use Case | Main Limitations |
|---|---|---|---|---|---|---|
| 1. Ocean Dry-Bulk Shipping | Coal, grain, iron ore, fertilizers, minerals and other unpackaged commodities | Approximately 10,000–400,000 deadweight tonnes (DWT), depending on vessel class | Generally 18–25 knots; intercontinental voyages commonly take several weeks | Very low unit cost for large, homogeneous cargo volumes | Large-volume cargo moving between ports with suitable bulk-handling facilities | Requires specialized terminals; less suitable for small lots, mixed cargo or frequent delivery schedules |
| 2. Ocean Container Shipping | Bagged commodities, packaged raw materials, machinery, consumer goods and palletized cargo | A standard 20-foot container usually carries about 28–30 tonnes of cargo, subject to local regulations and container limits | Often 15–45 days for major intercontinental routes, excluding port and customs delays | Low cost per unit for international cargo that can be containerized | Global shipments requiring network coverage, cargo protection and multimodal inland delivery | Port congestion, schedule variability, container availability and weight restrictions |
| 3. Breakbulk and Project-Cargo Shipping | Steel products, timber, machinery, industrial equipment, pipes and oversized units | Capacity varies by vessel and cargo; individual pieces may range from several tonnes to hundreds of tonnes | Usually 20–45 days for ocean legs, with additional time for special handling | Moderate to low for large or irregular cargo that cannot be containerized | Heavy-lift, oversized or non-standard shipments requiring customized loading plans | More complex planning, limited sailing frequency, weather sensitivity and specialized port equipment requirements |
| 4. Roll-on/Roll-off Transport | Cars, trucks, trailers, agricultural machinery, construction equipment and wheeled industrial cargo | Measured mainly in lane metres; cargo is loaded by driving or towing it onto the vessel | Generally 15–22 knots at sea; total delivery time depends heavily on port rotation and inland movement | Competitive for self-propelled or towable cargo | Vehicles and wheeled equipment that can be loaded without extensive lifting or disassembly | Requires operational wheels or suitable rolling gear; cargo dimensions may exceed deck or ramp limits |
| 5. Rail Freight | Bulk commodities, containers, metals, machinery, agricultural products and manufactured goods | A freight train can carry roughly 1,000–3,000 tonnes, depending on infrastructure, locomotive power and route rules | Regional and cross-border delivery commonly ranges from 2–15 days | Usually lower than road for long distances and higher than ocean for intercontinental movement | Large inland volumes, long-distance corridors and predictable land-based schedules | Dependent on rail infrastructure, border procedures, gauge compatibility and terminal access |
| 6. Road Freight | Palletized goods, packaged materials, machinery, agricultural products and regional bulk loads | A standard articulated truck commonly carries approximately 20–25 tonnes, subject to vehicle and road regulations | About 1–5 days for many regional or cross-border movements | Competitive for short and medium distances; generally more expensive than rail or ocean for very long distances | Door-to-door delivery, flexible routing and first-mile or last-mile distribution | Road congestion, driver-hour rules, tolls, weather disruptions and border delays |
| 7. Air Freight | High-value components, urgent production inputs, samples, medical products and time-sensitive goods | Capacity ranges from small consignments to many tonnes per flight, depending on aircraft and service type | Commonly 1–5 days airport-to-airport, excluding customs and inland handling | Highest cost per kilogram among the listed options | Urgent replenishment, short product life cycles and cargo where delay costs exceed freight premiums | High price, lower shipment density, strict safety rules and restrictions on hazardous or oversized cargo |
Related Posts
-
How to Choose the Right Bulk Transport Solution for Your Business?
-
2026 Best Bulk Transport Companies for Global Shipping?
-
How to Master Bulk Transport Strategies for Efficient Logistics?
-
How to Optimize Container Transport for Global Sourcing?
-

How to Choose the Right Bulk Transport Solutions for Your Business?
-
2026 Best Central Asia Rail Transport Options for Global Buyers?