2026 Best International Transportation Methods?
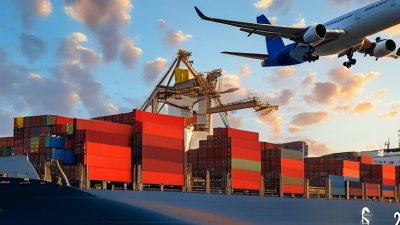
Choosing the best International Transportation method in 2026 requires more than comparing prices or delivery speeds. Each route has different risks, costs, emissions, and compliance requirements. Sea freight may suit large, non-urgent shipments, while air freight remains valuable for lightweight goods with strict deadlines. Rail and road services can strengthen regional connections, especially when ports face congestion.
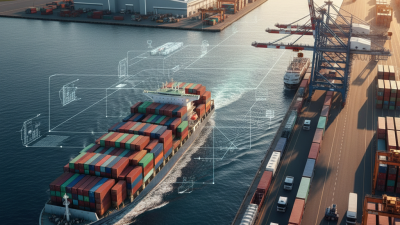
This guide examines practical transportation choices through the lens of cost, reliability, visibility, and environmental performance. It considers multimodal shipping, where containers move between vessels, trains, trucks, and distribution centers. A refrigerated shipment, for example, may require continuous temperature monitoring from the warehouse to the final delivery point. A delayed customs document can matter as much as a delayed truck.
Real experience shows that no single method is always best. Not even close. A cheaper route may create storage costs, missed production windows, or difficult customer communication. Faster service may also produce higher emissions and stricter handling requirements. We may overvalue speed when predictable delivery matters more.
Reliable planning should use current carrier schedules, verified customs guidance, insurance terms, and accurate product information. Freight forwarders and logistics specialists can help compare routes, but their recommendations still deserve careful review. Data changes quickly in 2026. Port conditions, fuel prices, trade policies, and weather can reshape a decision within days.
The following sections compare major International Transportation methods and explain when each option works best. They also identify common planning mistakes, measurable selection criteria, and practical ways to improve shipment visibility. The goal is not a perfect ranking. It is a clearer, more responsible decision.
Global Benchmark: Maritime Shipping Carries Over 80% of Trade Volume (UNCTAD)
2026 Best International Transportation Methods?
Maritime transport remains the backbone of global commerce. UNCTAD reports that ships carry over 80% of world trade by volume. That figure reflects the strength of sea freight for heavy, bulky, and non-urgent cargo. A single vessel can move thousands of containers across oceans, reducing the cost per unit. Ports, customs teams, and freight planners also support this mature network.
Sea transport is not always the best choice. Air freight suits urgent medical equipment, seasonal products, and small high-value shipments. Rail can offer a practical middle option across connected land routes. Road transport remains essential for local collection and final delivery. In real planning, cost is only one factor. Weather delays, port congestion, fuel changes, and cargo sensitivity also matter. The 80% figure is useful, but it can hide important differences between industries.
Tips: Match the method to cargo weight, urgency, distance, and risk. Check port reliability before booking. Build extra time into ocean schedules. Confirm packaging strength for long handling cycles. Keep accurate documents and shipment records. Small errors become expensive at borders. A blended route may work better than one method. Review the plan regularly, because trade conditions change quickly.
Rail and Road: Compare Emissions, Cost, Capacity, and Border Reach
2026 Best International Transportation Methods?
For international freight, rail usually emits less than road. The Smart Freight Centre’s GLEC Framework 3.0 estimates roughly 22 grams of CO2e per tonne-kilometre for rail, versus about 62 grams for road. Actual results change with locomotive fuel, electricity sources, load factor, and empty returns. Clean electricity helps. Poorly loaded trains do not.
Cost depends heavily on distance and border handling. OECD and International Transport Forum studies show rail becomes more competitive as shipment weight and route length increase. A full train can move hundreds of containers with fewer drivers and less fuel. Road transport remains more practical for short routes, scattered deliveries, and final-mile access. It can reach warehouses directly, while rail often requires cranes, terminals, and extra trucking. Those transfers add time and cost.
Rail also offers stronger corridor capacity. One train may replace many heavy trucks on a busy route, reducing highway pressure. The International Union of Railways reports that rail can provide substantial efficiency gains for bulk and container freight. Yet border reach is not equal. Different track gauges, customs systems, and electrification standards can interrupt journeys. Road networks usually cross more borders with fewer technical changes. That advantage is easy to underestimate. A blended route often works better: rail for the long middle distance, then road for local delivery. This is not always the cheapest choice, especially where terminals are remote or schedules are irregular.
Intermodal 2026: Combine Sea, Rail, Road, and Air by Shipment Profile
2026 Best International Transportation Methods?
Intermodal 2026: Combine Sea, Rail, Road, and Air by Shipment Profile
The strongest international transport plan matches each shipment’s risk, value, urgency, and destination. Sea freight remains the volume leader, carrying over 80% of global merchandise trade by volume, according to UNCTAD’s Review of Maritime Transport 2024. It suits replenishment cargo, machinery, and non-urgent inventory. Rail can shorten inland transit across connected corridors, while road provides flexible collection and final delivery.
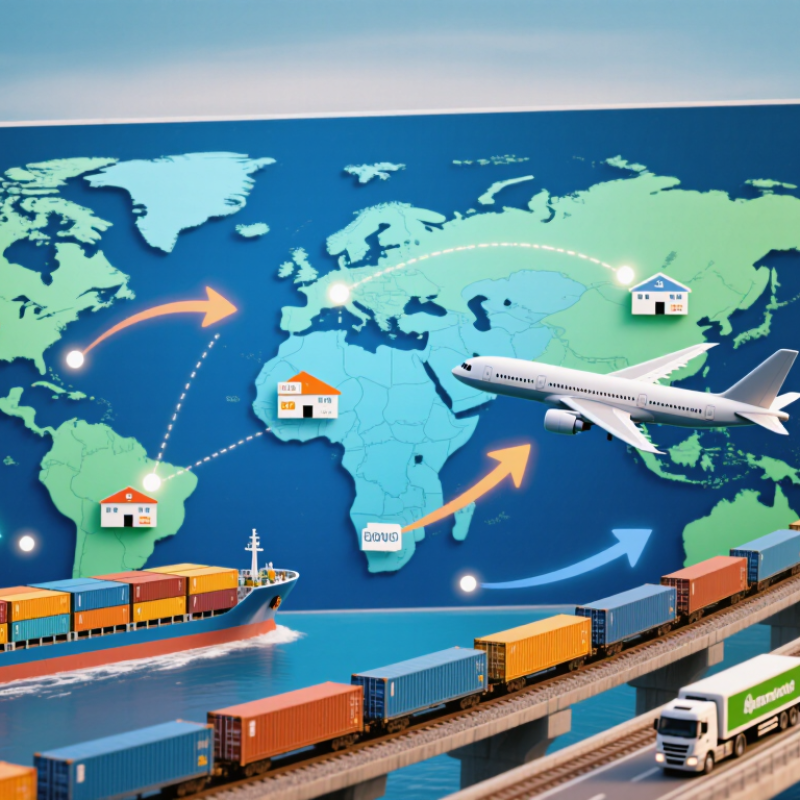
Air freight fits critical components, seasonal products, and high-value shipments. IATA reported that global air cargo demand increased 11.3% in 2024, measured in cargo tonne-kilometres. Speed is expensive. A practical 2026 plan may move goods by sea to a regional hub, rail across the main corridor, and road to the consignee. Air can cover only the urgent portion.
Shipment profiles should guide the decision. Temperature sensitivity, customs complexity, packaging limits, and delivery windows matter more than a simple freight-rate comparison. The World Bank’s Logistics Performance Index 2023 also highlights the importance of reliability, tracking, and border efficiency. I still see companies choosing one mode for every order. That approach looks simple, but it can create stockouts or unnecessary emissions. Data quality is another weakness. Transit estimates often ignore port congestion, handover delays, and failed delivery attempts. A better model reviews actual lane performance every quarter, then adjusts the modal mix.
Decision Framework: Rank Speed, Price, Reliability, Risk, and Carbon Output
2026 Best International Transportation Methods?
Decision Framework: Rank Speed, Price, Reliability, Risk, and Carbon Output
Choosing international transport is not about finding one universal winner. The right method depends on cargo value, delivery pressure, distance, and environmental targets. A practical decision starts by ranking five factors: speed, price, reliability, risk, and carbon output.
Air freight usually leads on speed, but it can carry higher costs and emissions. Ocean transport often lowers the price for heavy cargo, although port congestion may extend delivery by several weeks. Rail can balance speed and carbon output on suitable land routes. Road transport adds flexible collection and delivery, but border delays remain a concern.
Use a simple score from one to five for each factor. Give delivery-critical medical equipment a high speed and reliability score. Give ordinary furniture more weight on price and carbon output. For a 500-kilogram shipment, compare fuel surcharges, handling fees, insurance, customs preparation, and storage costs. The cheapest quote may become expensive after delays.
Risk matters.
Check weather exposure, transfer points, packaging strength, cargo value, and route stability. Temperature-sensitive goods may need monitored containers and documented handling procedures. Carbon estimates should include the full journey, not only the main vehicle.
My own scoring model is imperfect. It can undervalue sudden port closures or inaccurate transit estimates. Recheck the ranking when shipment details change. A reliable decision combines data, experienced freight advice, and a clear record of every assumption.
2026 Best International Transportation Methods? — Decision Framework: Rank Speed, Price, Reliability, Risk, and Carbon Output
| Rank |
Transportation Method |
Typical Transit Time* |
Indicative Price* |
Reliability |
Operational Risk |
Carbon Output** |
Speed Score |
Price Score |
Reliability Score |
Risk Score |
Carbon Score |
Weighted Total |
Best Use Case |
| 1 |
International Air Express |
1–5 days |
US$8–25/kg |
85–95% |
Medium |
500–1,000 g CO₂e/t-km |
10/10 |
2/10 |
8/10 |
6/10 |
1/10 |
5.7/10 |
Urgent, high-value, lightweight shipments |
| 2 |
Scheduled Air Freight |
3–10 days |
US$3–10/kg |
80–92% |
Medium |
500–1,000 g CO₂e/t-km |
9/10 |
4/10 |
8/10 |
6/10 |
1/10 |
6.0/10 |
Time-sensitive commercial cargo |
| 3 |
Rail Freight |
14–30 days |
US$0.10–0.40/kg |
75–90% |
Medium–High |
20–40 g CO₂e/t-km |
6/10 |
7/10 |
7/10 |
5/10 |
8/10 |
6.8/10 |
Long-distance land corridors and balanced lead-time needs |
| 4 |
Ocean Container Freight |
25–60 days |
US$0.03–0.15/kg |
65–85% |
Medium–High |
8–30 g CO₂e/t-km |
3/10 |
10/10 |
6/10 |
5/10 |
10/10 |
6.8/10 |
Large, heavy, non-urgent shipments |
| 5 |
Multimodal Rail–Road Freight |
18–40 days |
US$0.08–0.35/kg |
70–85% |
Medium–High |
35–90 g CO₂e/t-km |
5/10 |
8/10 |
6/10 |
5/10 |
8/10 |
6.5/10 |
Cost-conscious shipments needing more speed than ocean freight |
| 6 |
Cross-Border Road Freight |
2–14 days |
US$0.10–0.60/kg |
75–90% |
Medium |
60–150 g CO₂e/t-km |
8/10 |
6/10 |
7/10 |
6/10 |
5/10 |
6.4/10 |
Regional international trade with direct delivery needs |
Decision assumptions:
The weighted total uses Speed 25%, Price 20%, Reliability 20%, Operational Risk 15%, and Carbon Output 20%. Scores are comparative planning indicators on a 1–10 scale; higher is better. Transit times and prices are indicative international ranges for general cargo and can vary by lane, shipment size, customs processing, season, fuel costs, border conditions, and service level.
Measurement notes:
Reliability refers to the expected ability to meet a planned delivery window. Operational Risk reflects exposure to weather, congestion, border delays, handling events, and network disruption. Carbon figures are broad well-to-wheel planning ranges expressed as grams of CO₂-equivalent per tonne-kilometre; actual emissions depend on equipment, load factor, route, and distance.